The “R” Word

Our clients wonder what a recession would mean for the real estate market.

Many assume it would translate into a downturn in prices.

Some even worry that it would cause values to come crashing down.

We looked back in history, at past recessions, to gain an understanding of what recessions mean for the Front Range market.

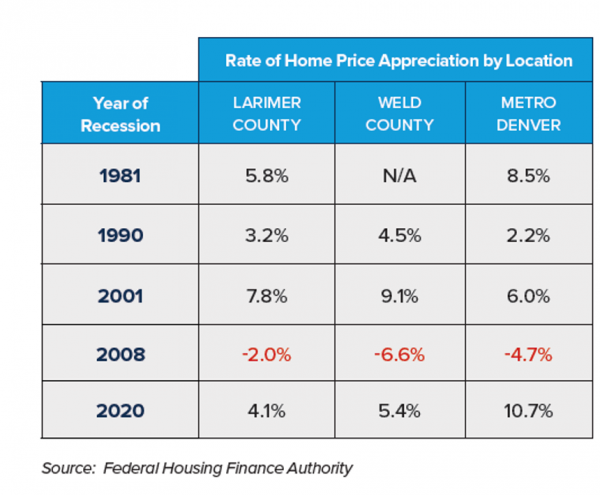
We used the extensive data from the Federal Housing Finance Authority to look at home price appreciation during the five recessions dating back to 1981.

What we found was quite interesting.

During the five recessions of 1981, 1990, 2001, 2008 and 2020, home prices along the Front Range went up in all but the 2008 recession.

What was unique about 2008 was that housing led the recession.  Whereas the other recessions were triggered by some combination of inflation, oil prices, and stock market issues (plus the pandemic in 2020).

So, if the past is an indicator of the future, a recession is not guaranteed to result in lower real estate prices.

The Front Range real estate market has always demonstrated long-term health and a great resiliency to outside economic events.

See the chart below for the detailed research…

The post The “R” Word appeared first on Fort Collins Real Estate | Fort Collins Homes for Sale & Property Search.

Asking Price Drop

Data just released by Altos Research shows that 35% of all homes on the market have had to reduce their asking price.

This is the highest this number has been since December of 2019.

This is also an indicator of sellers adjusting to the reality of the new market where overly aggressive pricing is not effective.

Extensive research shows the importance of pricing a home correctly on the first day so that the home sells in an appropriate time frame.

The post Asking Price Drop appeared first on Fort Collins Real Estate | Fort Collins Homes for Sale & Property Search.
More Days

A stat that we have expected to change is finally changing.

“Days on Market” measures how long it takes for new listings to sell.

Over the last two years this stat plummeted to levels we have never seen before.

In the height of the market frenzy a year ago, properties were taking 7 days or less to sell on average.

Now, with the market cooling, Days on Market is back into double-digits.

Northern Colorado is at 20 days, a 54% increase over last year.

Metro Denver is at 12 days which is a 50% increase.

The post More Days appeared first on Fort Collins Real Estate | Fort Collins Homes for Sale & Property Search.

Two Week Snapshot

Here is a quick snapshot of our markets two weeks into July versus the same time last year…

Larimer & Weld Counties:

  • Inventory up 61%
  • Transaction count down 44%
  • Prices up 17%

Metro Denver:

  • Inventory up 62%
  • Transaction count down 31%
  • Prices up 12%

The post Two Week Snapshot appeared first on Fort Collins Real Estate | Fort Collins Homes for Sale & Property Search.

Top Three

Here are the top three reasons why prices are unlikely to crash even though the market has cooled off:

  1. Inventory – Ultimately, prices are driven by supply and demand.  Although supply has increased, it still remains relatively low with less than two months’ supply in most areas.
  2. New Homes – New home construction still lags behind the demand stemming from population growth.  New home starts today are roughly 2/3 of what they were in 2005.
  3. Credit – Home buyers today are highly qualified which protects the market from a glut of ‘distressed’ properties hitting the market in an economic downturn.  The average credit score of buyers is now 776 which, by definition, is ‘excellent.’   Only 2% of loans today are given to buyers with scores under 640 whereas in 2001 25% of buyers had that low of a score.

The post Top Three appeared first on Fort Collins Real Estate | Fort Collins Homes for Sale & Property Search.

Weeks to Months

For the first time in almost two years, there is more than a month’s worth of inventory on the market.

This means that at the current pace of sales, it would take more than a month to sell all of the homes currently for sale.

This is certainly welcome news for buyers who have been craving a less frenzied market.

Since the market took off in the summer of 2020, inventory levels have been measured in terms of weeks.

Two to three weeks of inventory was the typical measurement for the last two years.

Today, inventory levels look like this:

  • Larimer County = 1.1 months
  • Weld County = 1.2 months
  • Metro Denver = 1.2 months

The post Weeks to Months appeared first on Fort Collins Real Estate | Fort Collins Homes for Sale & Property Search.

Still Behind

Single family new housing starts in 2022 will show an increase versus last year, will be the most since 2007, and will still be well behind the peak of 2006.

This year, experts predict that a total of 1.1 million single family homes will be started. In 2021 there were 970 thousand new home starts.

The peak occurred in 2006, when 1.65 new homes were started.

So, this year will finish 33% behind the peak.

When we are asked why today’s market is different from the ‘bubble years’ of 2004 to 2007, the difference in new home starts is one reason we cite.

Even though the market is cooling, we remain significantly undersupplied which insulates prices from any kind of dramatic downturn.

The post Still Behind appeared first on Fort Collins Real Estate | Fort Collins Homes for Sale & Property Search.

What the Numbers Say

During a time of varying opinions and heavy speculation about the Front Range real estate market, let’s see what the actual numbers are telling us:

Inventory is up significantly year over year:

  • Larimer County = +48%
  • Weld County = +52%
  • Metro Denver = +74%

However, supply is still low as measured by months of inventory:

  • Larimer County = 1.1 Months
  • Weld County = 1 Month
  • Metro Denver = 1 Month

Transaction count is down as the pace of sales is slowing:

  • Larimer County = -24%
  • Weld County = -15%
  • Metro Denver = -19%

Yet, average prices are still up versus last year:

  • Larimer County = +18%
  • Weld County = +10%
  • Metro Denver = +14%

The post What the Numbers Say appeared first on Fort Collins Real Estate | Fort Collins Homes for Sale & Property Search.