Big Bounce

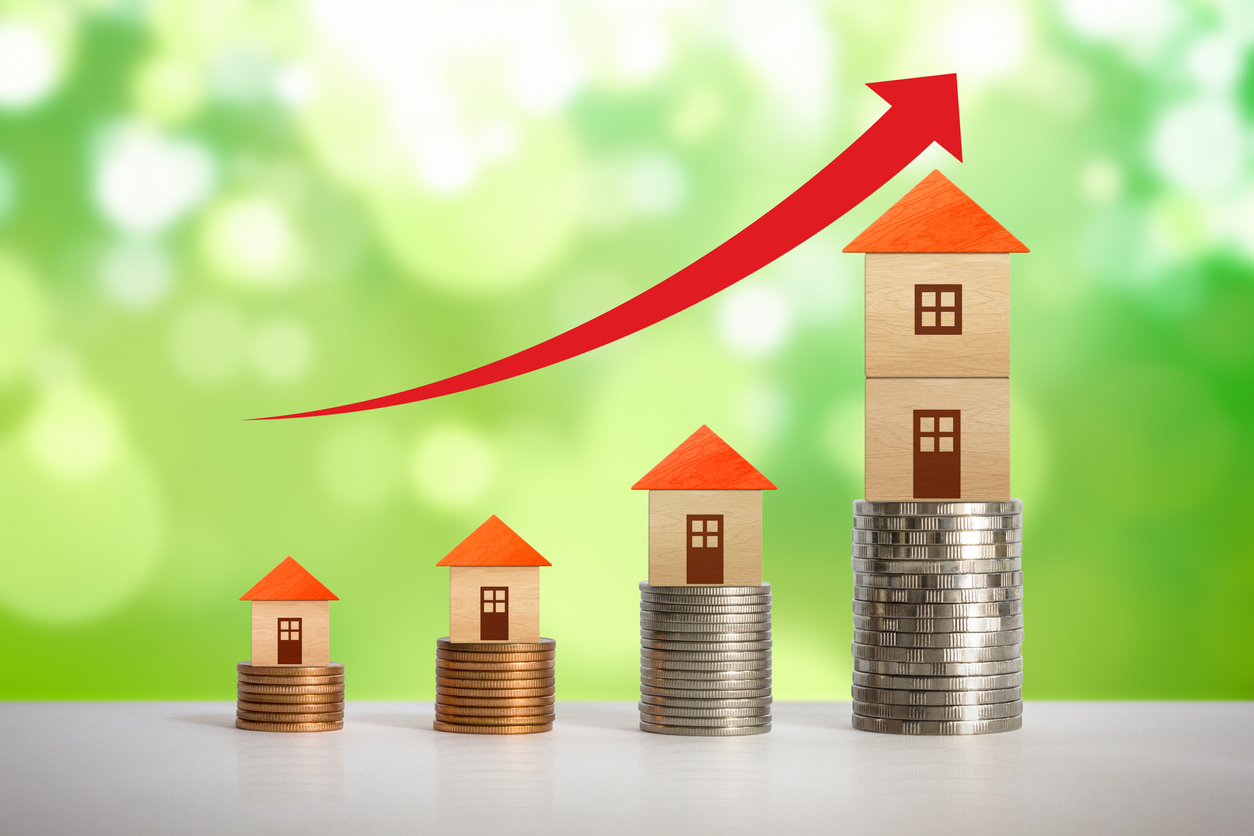
Seventy-five major metro markets have seen home prices bounce back to above their pre-recession peaks.

Metro Denver has seen the biggest bounce with home values 91% above its previous high in 2007 , according to the Home Price Recovery Index from HSH.com.

“Aside from routinely strong home price appreciation, it’s important to know that the Denver metro’s housing ‘bust’ in 2008 was relatively short and shallow,” said Keith Gumbinger, the report’s author.

The peak-to-trough for home values was only three years long and the total decline in value was just under 8 percent in Metro Denver, he said.

By contrast, a half-dozen large metros have seen home prices more than double from their lows and still not reach the old highs. On that list are Las Vegas, Sacramento, Calif, and Cape Coral, Fla.

The post Big Bounce appeared first on Fort Collins Real Estate | Fort Collins Homes for Sale & Property Search.

Rate Bounce

Rates hit near-historic lows this week and are now at 3.49% for a 30-year mortgage.

There have only been two other times in history when rates have been this low- April 2013 and October 2016.

It’s interesting to see what happened soon after bottoming out these last two times.

In April of 2013 rates hit 3.41%. By August 2013 they had jumped to 4.40%.

Rates bottomed again in October 2016 at 3.42%. Just two months later in December 2016 they were 4.32%.

Each time the increase was nearly 1% within just a few months.

So, if history proves itself as a guide, we can’t expect these rates to last for long.

The post Rate Bounce appeared first on Fort Collins Real Estate | Fort Collins Homes for Sale & Property Search.

On Sale

With interest rates so low, one could argue that money is essentially on sale.

It’s actually half off.

30-year mortgage rates hit 3.75% which is exactly half of their long term average.

Rates have averaged 7.5% over the last 40 years so today buyers are getting half of that rate.

The “sale” on mortgage rates creates a significant savings in monthly payment because of the 1%/10% rule.

For every 1% change in interest rate, the monthly payment will change roughly 10%.

So when rates go up to 4.75%, a buyer’s payment will be 10% higher.

For example, the principal and interest payment on a $400,000 home with a 20% down payment at today’s rates is $1,482.

If rates were 1% higher, the payments jump up to $1,669.

The post On Sale appeared first on Fort Collins Real Estate | Fort Collins Homes for Sale & Property Search.

Why No Bubble


There are several reasons why our Chief Economist does not believe there is a housing bubble today in the U.S.

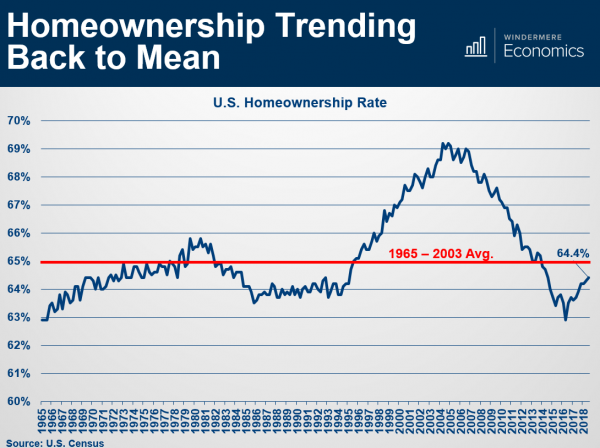
Below is a slide he shared at our recent market Forecast events.

It shows U.S. Home ownership rate, which is simply the percentage of the population who own their home (versus renting).

The long-term average is 65% represented by the red line.

In the graph you can clearly see the bubble forming. Starting in the mid-90’s, driven by several political and economic factors, more people than ever before became homeowners.


Then, starting in, 2008, the bubble burst and the percentage tumbled back down.

Now, as you can see, we are back at a “normal” level that resembles the long-term average.

________________________________________

If you would like a copy of the entire Forecast presentation, go ahead and reach out to us. We would be happy to put it in your hands.

The post Why No Bubble appeared first on Fort Collins Real Estate | Fort Collins Homes for Sale & Property Search.
Still Up

All the talk of the market cooling off might make someone think that prices must be going down.

The truth is prices are still going up.

Here are the latest year-over-year appreciation numbers from the Federal Housing Finance Authority (they track 243 markets all across the Country):

Colorado Springs 11.44%

Greeley 10.53%

Denver 9.97%

Boulder 9.89%

Fort Collins/Loveland 8.64%

The post Still Up appeared first on Fort Collins Real Estate | Fort Collins Homes for Sale & Property Search.