Colorado Bound

The 2020 Census confirms what we already know – Colorado is popular!

It turns out that many people have been Colorado-bound over the last 10 years.

Our state has grown by the equivalent of one Mile High Stadium’s-worth of people each year over the last 10 years.

Here are the numbers:

  • 2020 population is 5.77 million
  • 10-year population increase is 744,000
  • 10-year percentage increase is 14.8%
  • Colorado ranks 21st among all states for population
  • Only 5 states had a larger percentage increase over the last 10 years (Idaho, North Dakota, Nevada, Texas & Utah)

Only 8 states had a larger increase in population over the last 10 years (Arizona, California, Florida, Georgia, New York, North Carolina, Texas & Washington

The post Colorado Bound appeared first on Fort Collins Real Estate | Fort Collins Homes for Sale & Property Search.

Housing Math

It’s interesting to look at what population growth means for housing.


On average, along the Front Range, 2.5 people live in each housing unit.


What that means is 4 housing units are needed for every 10 people who live here.


So, for every 1000 new people moving to our area, 400 new housing units are required.


The population of Metro Denver is just under 3,000,000 and the population of Northern Colorado is just over 650,000.


Assuming the Front Range grows in population at 2% per year, that means 60,000 new people in Metro Denver and 13,000 new people in Northern Colorado each year.


To house those people, 24,000 new housing units need to be built per year in Metro Denver and 5,200 in Northern Colorado.

At Windermere Real Estate we are taking Safer at Home and Social Distancing very seriously.  Our people are following our Safe Showings protocol, staying connected to their clients, and providing help wherever needed

The post Housing Math appeared first on Fort Collins Real Estate | Fort Collins Homes for Sale & Property Search.
Why No Bubble


There are several reasons why our Chief Economist does not believe there is a housing bubble today in the U.S.

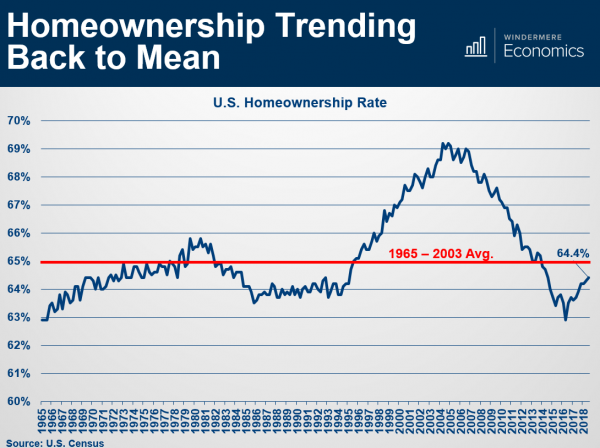
Below is a slide he shared at our recent market Forecast events.

It shows U.S. Home ownership rate, which is simply the percentage of the population who own their home (versus renting).

The long-term average is 65% represented by the red line.

In the graph you can clearly see the bubble forming. Starting in the mid-90’s, driven by several political and economic factors, more people than ever before became homeowners.


Then, starting in, 2008, the bubble burst and the percentage tumbled back down.

Now, as you can see, we are back at a “normal” level that resembles the long-term average.

________________________________________

If you would like a copy of the entire Forecast presentation, go ahead and reach out to us. We would be happy to put it in your hands.

The post Why No Bubble appeared first on Fort Collins Real Estate | Fort Collins Homes for Sale & Property Search.