Condo Cyclone


While the “Bomb Cyclone” closed roads and schools over the last two days, the “Condo Cyclone” is opening new opportunities for first-time buyers.


What’s the “Condo Cyclone” you ask. It’s the proliferation of multi-family inventory that has come on the market up and down the Front Range.

Compared to last year, multi-family inventory which includes town-homes and condominiums, has increased…


• 79% in Metro Denver
• 34% in Larimer County
• 45% in Weld County


This is terrific news for the market overall, as inventory has been unusually low for several months. It’s especially terrific news for first-time buyers who need this type of product as a stepping stone to home ownership.


What we notice is a $170,000 to $130,000 difference in average price between a single-family home and a multi-family home in Front Range markets.


Specifically, here’s the spread between multi-family and single-family average price:

• $349,801 vs. $512,312 in Metro Denver
• $312,493 vs. $469,294 in Larimer County
• $237,645 vs. $370,027 in Weld County


So as we dig out from the “Bomb Cyclone” we can be happy for the “Condo Cyclone” which brings more affordability and opportunity to our markets!

______________________________________________________________________

Just Released (a new resource site just for you…)
• Want to see the latest market trends?
• Curious to see the process of buying or selling a home?
• Interested in what it takes to own investment property?
• Be sure to visit www.ColoradoLivingBlog.com


The post Condo Cyclone appeared first on Fort Collins Real Estate | Fort Collins Homes for Sale & Property Search.

The Office


As you travel around the Front Range you will notice the following under construction:


  • New Homes
  • New Apartments
  • New Medical Facilities


However, you will not notice new office buildings under construction.

What gives?  I thought we had a booming economy.  Why no new office buildings?

There are a couple of reasons.  First, construction costs have sky rocketed.  In ten years, construction costs have gone from about $200 per square foot to over $300 per square foot.

Rental rates have not increased at the same pace as construction costs so speculative investors can’t make their numbers work.

It’s too expensive to build compared to the rents that can be charged.

One reason why rental rates haven’t increased at high rate is property taxes.  Property taxes on Class A office buildings have basically doubled in the last 10 years in many cases.

So, until rental rates catch up with construction costs, we won’t see many new office buildings under construction.

The post The Office appeared first on Fort Collins Real Estate | Fort Collins Homes for Sale & Property Search.

Vegas Baby!


The results are in from FHFA.gov’s latest ranking of the top performing markets in the U.S.

Each quarter they track 245 cities across the country and rank their real estate markets by home price appreciation.      


What’s the highest performing city the the U.S.

Vegas!  Their prices have gone up 17.63% in the last year.


How about the worst?

Bloomington, Illinois sits in dead last where prices went down 3.58%


Here’s how Colorado cities are ranked:

    • #10 Colo. Springs = 11.41%
• #16 Greeley = 10.68%
• #59 Fort Collins = 8.29%
• #64 Denver = 8.15%
• #97 Boulder = 6.85%

The post Vegas Baby! appeared first on Fort Collins Real Estate | Fort Collins Homes for Sale & Property Search.

4 in 40

Did you know, according to FHFA, proces in Larimer County have dropped more than 1% only4 times in the last 40 years?
FHFA stands for the Federal Housing Finance Authority. We are one of 261 markets that they track. Since 1978 they have been measuring home price appreciation here.
If you look at the appreciation numbers for each individual year, you will notice that most years the prices go up and some years the prices go down.
But there have only been 4 times in those 40 years where prices decreased more than 1%
Heres what happened those 4 times:
• 1982 = -3.99%
• 1987 = -1.86%
• 2008 = -2.29%
• 2010 = -1.12%
Sometimes we hear buyers say that they would like to wait for the “prices to come crashing down.” The reality is that the price drops don’t happen all that often and when they do, they don’t drop by that much at all.
If you would like to see a short video with a recap of our annual Market Forecast presentation, watch the video below.
Welcome to Friday Fun Facts
Thanks for checking out this week’s Friday Fun Facts!
These little nuggets of information are designed to inform, educate and entertain you. I promise to give you some solid takeaways, based on real life with information that will keep you up-to-date.
You can expect an entertaining short video or article once a weel.. If you really like it, share it with your friends!

The post 4 in 40 appeared first on Fort Collins Real Estate | Fort Collins Homes for Sale & Property Search.

The Whole Story

Metro Denver has 2.1 months of inventory on the market. This means that, at the current pace of sales, it would take just over 2 months to sell every single-family home currently listed for sale.

But that’s not the whole story because inventory levels vary drastically depending upon the price of the home.

When we take a closer look at months of inventory broken down by price range this is what we see:

• Under $400,000 = 0.9 months
• $400,000 to $500,000 = 1.8 months
• $500,000 to $750,000 = 3.1 months
• $750,000 to $1,000,000 = 4.2 months
• Over $1,000,000 = 7.7 months

These numbers represent great news for move-up buyers because they can sell in a strong market and potentially move up to a market that is market that is not as strong.


              Below is a short video with a recap of our annual Market Forecast presentation!

The post The Whole Story appeared first on Fort Collins Real Estate | Fort Collins Homes for Sale & Property Search.
How’s 2019?

A lot of our clients are asking how 2019 is starting off.

Here’s one thing we notice…

There are more homes to choose from, which is great news for buyers.

In January alone 4,821 homes came on the market in Metro Denver.

That is a 14% increase compared to one year ago.

At our annual Market Forecast, we predicted a more balanced market in 2019, so far it looks like we are trending that way.

________________________________________________________________________________________

Below is the recap of our Denver Annual Market Forecast!

The post How’s 2019? appeared first on Fort Collins Real Estate | Fort Collins Homes for Sale & Property Search.

Why No Bubble


There are several reasons why our Chief Economist does not believe there is a housing bubble today in the U.S.

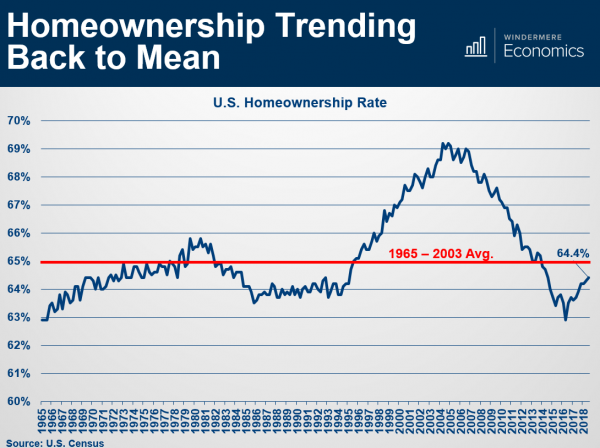
Below is a slide he shared at our recent market Forecast events.

It shows U.S. Home ownership rate, which is simply the percentage of the population who own their home (versus renting).

The long-term average is 65% represented by the red line.

In the graph you can clearly see the bubble forming. Starting in the mid-90’s, driven by several political and economic factors, more people than ever before became homeowners.


Then, starting in, 2008, the bubble burst and the percentage tumbled back down.

Now, as you can see, we are back at a “normal” level that resembles the long-term average.

________________________________________

If you would like a copy of the entire Forecast presentation, go ahead and reach out to us. We would be happy to put it in your hands.

The post Why No Bubble appeared first on Fort Collins Real Estate | Fort Collins Homes for Sale & Property Search.

Misery Index


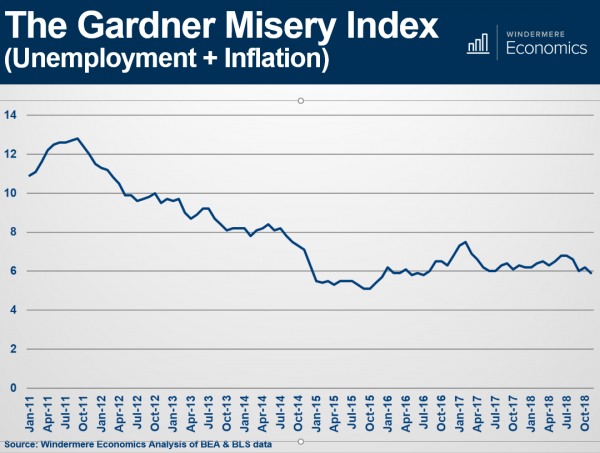
Last week at our Market Forecast events, Chief Economist Matthew Gardner shared, among many stats, his famous “Misery Index.”

A valuable statistic with a funny title.

The Misery Index simply measures inflation plus unemployment.

It’s an effective way to look at our Nation’s economy.

Today’s Index sits just below 6%. Back in October 2011, it was close to 13%.

The lowest it has been in the last 7 years is October 2015 when it was near 5%.

       ________________________________________

         If you would like a copy of the entire Forecast presentation, go ahead and reach out to us. 

We would be happy to put it in your hands.

The post Misery Index appeared first on Fort Collins Real Estate | Fort Collins Homes for Sale & Property Search.

Our Forecast

This past Wednesday and Thursday evenings we had the pleasure of hosting our annual Market Forecast events in Denver and Fort Collins.

Thank you to the 700 people who attended. We appreciate your support!

In case you missed the events, here are some highlights including our forecast for price appreciation in 2019:
• In 2018 Prices went up:
o 8% in Fort Collins
o 8% in Loveland
o 8.5% in Greeley
o 8% in Metro Denver

Inventory is (finally) showing signs of increasing:
o Up 25% in Northern Colorado
o Up 45% in Metro Denver

• There are distinct differences in months of inventory across different price ranges = opportunity for the move up buyer.

• There are several reasons why we don’t see a housing bubble forming:
o New home starts along the Front Range are roughly 60% of pre-bubble highs 14 years ago.
o Americans have more equity in their homes than ever, $6 Trillion!
o The average FICO score of home buyers is significantly higher than the long-term average.
o The home ownership rate is back to the long-term average.

• Our 2019 Price Appreciation Forecast:
o 6% in Fort Collins
o 6% in Loveland
o 7% in Greeley
o 6% in Metro Denver

If you would like a copy of the presentation, go ahead and reach out to us. We would be happy to put it in your hands!

The post Our Forecast appeared first on Fort Collins Real Estate | Fort Collins Homes for Sale & Property Search.