The Last Decade

Did you know home values in Larimer County have more than doubled in the last ten years?

Larimer County average prices are up 125% compared to 2014.  Weld County’s are up 134%

Here’s where it gets interesting…

Many people would guess that a significant portion of those gains occurred in the last five years.

However, in Larimer County the last five years of price growth was only slightly higher than the previous five years.

Weld County actually saw more price growth, on a percentage basis, from 2014 to 2019 as compared to 2019 to today.

The post The Last Decade appeared first on Fort Collins Real Estate | Fort Collins Homes for Sale & Property Search.

Halfway Check

This is a market which is changing quickly.  We are studying the numbers every day so we can be clear about where the market is heading.

Here is a check on the market halfway through October.

Compared to last October…

  • Available inventory is up 73% in Northern Colorado and up 112% in Metro Denver.  This is significant for buyers who, for years, were challenged with limited selection.
  • Number of closed transactions is down 50% in Northern Colorado and 41% in Metro Denver.  This reflects the fact that fewer buyers are active right now given higher interest rates.

Prices continue to be higher than last year.  They are up 12% in Northern Colorado and 13% in Metro Denver.  We don’t expect double-digit increases to continue, but don’t expect anything like a price crash.

The post Halfway Check appeared first on Fort Collins Real Estate | Fort Collins Homes for Sale & Property Search.

Most Multi

There are more multi-family residential properties under construction than at any time since 1974.


890,000 properties with 2+ units are currently being built across the United States.  This includes both for-sale product, and for-rent product.


Additional supply is clearly beneficial for both buyers and renters and will hopefully relieve some of the housing affordability issues.


So, why are there so many multi-family units under construction?  There seem to be three key reasons.


1.  The rental market is especially undersupplied with product and developers see this opportunity.


2.  With the increase in residential prices, multi-family becomes the only option for many first-time buyers. 


3.  Supply chain constraints are causing extended construction timelines.

The post Most Multi appeared first on Fort Collins Real Estate | Fort Collins Homes for Sale & Property Search.

The Evolution of the Home Office

As the popularity of remote work has reached new heights in recent years, the needs of homeowners are changing. Home offices and workspaces have never been higher on buyers’ priority lists and sellers are finding ways to make their homes appeal to a remote working audience. So, what does this mean for the home office moving forward? How will it continue to evolve? Only time will tell. In the meantime, it’s more important than ever to curate a home office that fits your needs.

The Evolution of the Home Office

Whether you have a proper home office or work at a chair in your kitchen nook, what’s important is that you create a dedicated space for your work. This allows you to focus by limiting distractions that may arise from other areas of the house. It also brings a sense of work-life balance to your home by physically separating the spaces. Even if your space is limited, design your workspace to feel like its own designated spot by facing it away from an open room or pointing your workstation toward a window.

Continued Remote Work

For those who have worked remotely and will continue to do so, you’ve likely gotten a grasp of how your home workspace can best fit your unique needs. Perhaps you decided to ditch the desk chair for a yoga ball or switched out that old desk lamp for a therapy light. But now that remote work has become your long-term reality, it’s time to think about how the space will fit your long-term needs.

Gone are the days of your home workspace being an afterthought. Working from home long-term means that your home office is now one of the most-used spaces in the house, so it’s important to keep it organized. Declutter the space with efficiency and productivity in mind, prioritizing the items that are essential for your job. We work well when we feel well, and an organized space can help reduce anxiety and work-related stress.

As your remote work continues, it may be time to make investments that you were previously on the fence about making. Whether it’s a second monitor, a supportive floor mat under your chair, a new design on your wall for your Zoom background, or a standing desk, now that you’ll be working from home for the foreseeable future, it’s important that your home office provides you with all the tools you’ll need while inspiring you to do your best work. 

Returning to In-Person Work

For those whose days of a fully remote work schedule are coming to an end, your home office needs will evolve, so it’s important that the space reflects those changes.

  • Full-Time: Returning to in-person work full-time means your home office will be vacant for extended periods of the day. Because you won’t be using it nearly as much, you have the freedom to either keep it as is or convert the room into something else. If you’ve dreamt of having a game room, a home gym, a playroom for the kids, or creating your version of a home theater, this is the perfect opportunity to do so.
  • Part-Time / Hybrid / Flex: A hybrid or flex work schedule allows for flexibility with your home office. Paring down your workspace and transferring some equipment to your desk at work will help you declutter. Outfit both workspaces to fit your needs to avoid lugging equipment back and forth. For example, if one location is primarily meant for attending meetings and the other is for working on projects, you can curate each space accordingly.


For more information on how remote work can change your needs as a homeowner, read our blog on The Remote Worker’s Home Buying Process.

The post The Evolution of the Home Office appeared first on Fort Collins Real Estate | Fort Collins Homes for Sale & Property Search.

Zillow’s Shut Down

On Wednesday Zillow announced the shut down of its iBuying program because of mounting financial losses and increasing complexity in the real estate market.

The goal of this program was to buy properties directly from Sellers and then re-sell them for a profit.

Before looking at the interesting facts and numbers associated with this news, we want to acknowledge the people who are affected by this.

Zillow’s workforce will be reduced by 25%.  Many people will be laid off and our heart goes out to them.  We certainly wish them only the best.

Within our company we are not surprised by Zillow’s announcement.  We observed many cases where they over-paid for a property, re-listed it for an unrealistic price, dropped the price over time to meet the market, and then sold at an amount much less than what they paid.

It actually became difficult to find specific scenarios where they sold the home for more than their acquisition cost.  It was not uncommon to see losses of $50,000 per home or more.

Here is a quote from their CEO:  “Our observed error rate has been far more volatile than we thought possible.  Fundamentally, we have been unable to predict future pricing of homes to a level of accuracy that makes this a safe business to be in.“

In the third quarter of 2021 alone, their iBuying division lost $328 million.

Bottom line, their valuations were off.

It is a reminder that pricing requires a hyper-local scientific approach versus a generic algorithm

Homes are not commodities.  Each home is highly unique.  Each has its own highly unique location, features, amenities, condition and timing.

Homes can’t be priced like a book or a plane ticket.  Every unique feature must be taken into account.

Nationally, Zillow has about 7,000 homes in backlog which it hopes to sell over the next several months.

Other players remain in the iBuying game and we are more than happy to help you understand those options if you are curious.

The post Zillow’s Shut Down appeared first on Fort Collins Real Estate | Fort Collins Homes for Sale & Property Search.

Q3 2021 Colorado Real Estate Market Update

The following analysis of the Metro Denver & Northern Colorado real estate market is provided by Windermere Real Estate Chief Economist Matthew Gardner. We hope that this information may assist you with making better-informed real estate decisions. For further information about the housing market in your area, please don’t hesitate to contact your Windermere Real Estate agent.


Regional Economic Overview

The rise in COVID-19 infections due to the Delta variant caused Colorado’s job recovery to slow, but not as much as in many other states. The latest data (for August) shows that more than 293,000 of the 376,000+ jobs that were shed due to COVID-19 have returned. This is good news, with only 83,000 jobs needed to return to pre-pandemic employment levels. The metro areas contained in this report have recovered 243,700 of the 310,000 jobs lost, and I expect the state will recover the remaining jobs by next summer. With employment levels improving, the state unemployment rate currently stands at 5.9%—down from the pandemic peak of 12.1%. Regionally, unemployment levels range from a low of 4.4% in Boulder to a high of 6.1% in Grand Junction.


__________


Colorado Home Sales

❱ In the third quarter, 14,209 homes sold. This was 6.8% lower than a year ago, but 5.8% higher than the second quarter of 2021.

❱ Compared to a year ago, listing activity was down more than 30%. However, inventory levels were up 38.3% compared to the second quarter of this year, suggesting that buyers have more choice now than they have seen in some time.

❱ Although comparing current sales activity with that of a year ago is not that informative—given that the country was experiencing a massive rebound in housing demand following the outbreak of COVID-19—it was pleasing to see sales up in every county other than Denver and Douglas compared to the second quarter of this year.

❱ Pending sales (an indicator of future closings) were down 5.4% compared to the second quarter of the year, suggesting that closings in the final quarter may well be a little soft.
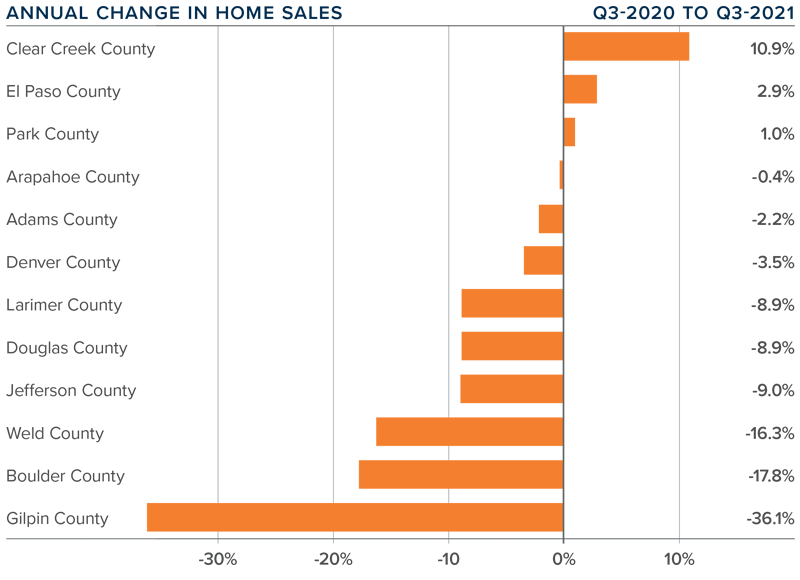
 

A bar graph showing the annual change in home sales for various counties in Colorado during the third quarter of 2021.

__________


Colorado Home Prices

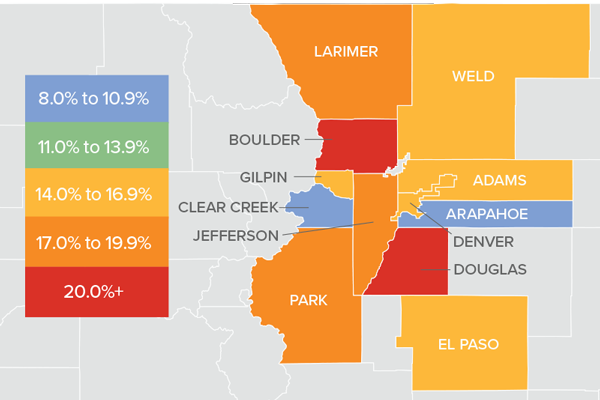
A map showing the real estate market percentage changes in various counties in Colorado during the third quarter of 2021.

❱ Prices continue to appreciate at a very rapid pace, with the average sale price up 15.8% year over year to an average of $605,576. Sale prices were 1.6% lower than in the second quarter of 2021.

❱ Four counties—Arapahoe, Douglas, Weld, and Park—saw the average home sale price pull back between the second quarter and the third, but I am not overly concerned by this at the present time.

❱ Year-over-year, prices rose across all markets covered by this report. All counties except Arapahoe saw double-digit gains, but even that market saw an increase in sale prices.

❱ Several counties are experiencing a drop in average list prices, which is a leading indicator of future activity. As such, I expect to see the rise of sale prices start to slow, which will be a welcome sight for many buyers.
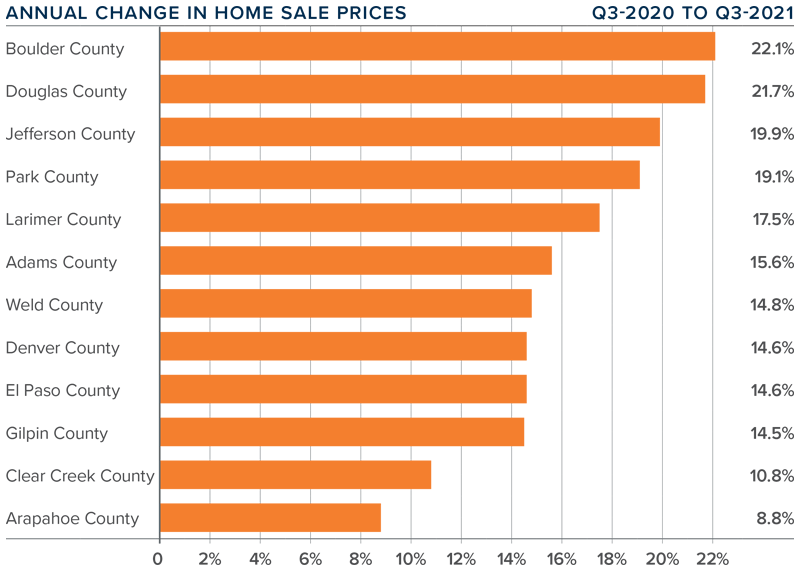
 

A bar graph showing the annual change in home sale prices for various counties in Colorado during the third quarter of 2021.

__________


Days on Market

❱ The average number of days it took to sell a home in the markets contained in this report dropped 17 days compared to the third quarter of 2020.

❱ The length of time it took to sell a home dropped in every county contained in this report compared to both the same quarter a year ago and the second quarter of this year.

❱ It took an average of only 12 days to sell a home in the region, which is down 2 days compared to the second quarter of 2021.

❱ The Colorado housing market remains very tight as demonstrated by the fact that it took less than three weeks for homes to sell in all counties contained in this report.
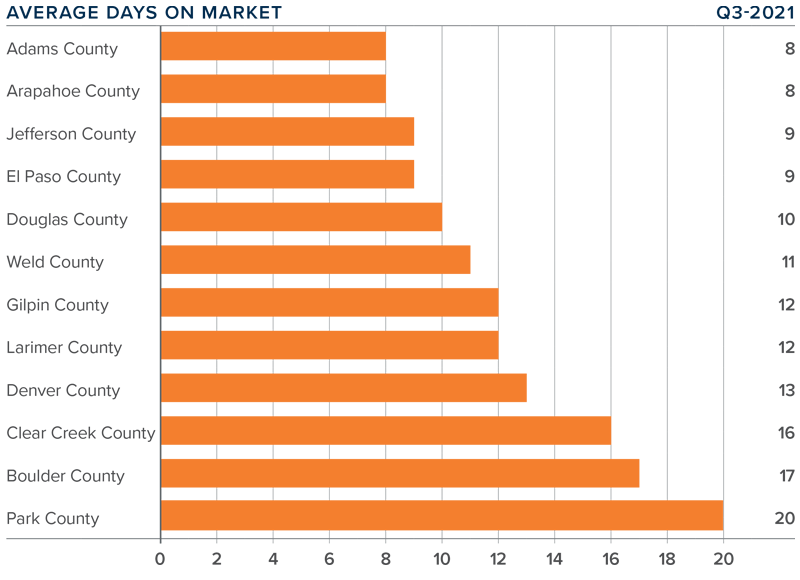
 

A bar graph showing the average days on market for homes in various counties in Colorado during the third quarter of 2021.

__________


Conclusions

A speedometer graph indicating a seller's market in Colorado during the third quarter of 2021.

This speedometer reflects the state of the region’s real estate market using housing inventory, price gains, home sales, interest rates, and larger economic factors.

The job market continues to improve, which is always a stimulant when it comes to home buying. Inventory levels have improved, and lower pending sales suggest that buyers are taking a little longer to decide on a home. That said, the market is still bullish as indicated by the short length of time it took to sell a home in the quarter. Mortgage rates will start to creep higher as we move into the winter months, and this may stimulate additional buying activity. In the last edition of The Gardner Report, I suggested we would see more homes come to market and that has proven to be accurate. Given these factors, I am moving the needle a little toward buyers, but it remains a staunchly seller’s market.


About Matthew Gardner

Matthew Gardner - Chief Economist for Windermere Real Estate

As Chief Economist for Windermere Real Estate, Matthew Gardner is responsible for analyzing and interpreting economic data and its impact on the real estate market on both a local and national level. Matthew has over 30 years of professional experience both in the U.S. and U.K.

In addition to his day-to-day responsibilities, Matthew sits on the Washington State Governors Council of Economic Advisors; chairs the Board of Trustees at the Washington Center for Real Estate Research at the University of Washington; and is an Advisory Board Member at the Runstad Center for Real Estate Studies at the University of Washington where he also lectures in real estate economics.

The post Q3 2021 Colorado Real Estate Market Update appeared first on Fort Collins Real Estate | Fort Collins Homes for Sale & Property Search.

Average Prices

It’s true, average prices have increased substantially over the last year.

Would you have guessed that Weld County has seen the largest increase along the Front Range?

The specific numbers are below.

As you look at the numbers, it is important to remember that average prices have increased because of appreciation and because there are more higher-end homes that are selling.

The increased volume of high-end transactions has played a big rule in increasing the average price.

Average Price of a Single-Family Home based on closings so far this month:

  • Metro Denver = $675,000
  • Larimer County = $624,000
  • Weld County = $514,000

Average Prices exactly one year ago:

  • Metro Denver = $614,000
  • Larimer County = $549,000
  • Weld County = $417,000

The post Average Prices appeared first on Fort Collins Real Estate | Fort Collins Homes for Sale & Property Search.